Tag
observability
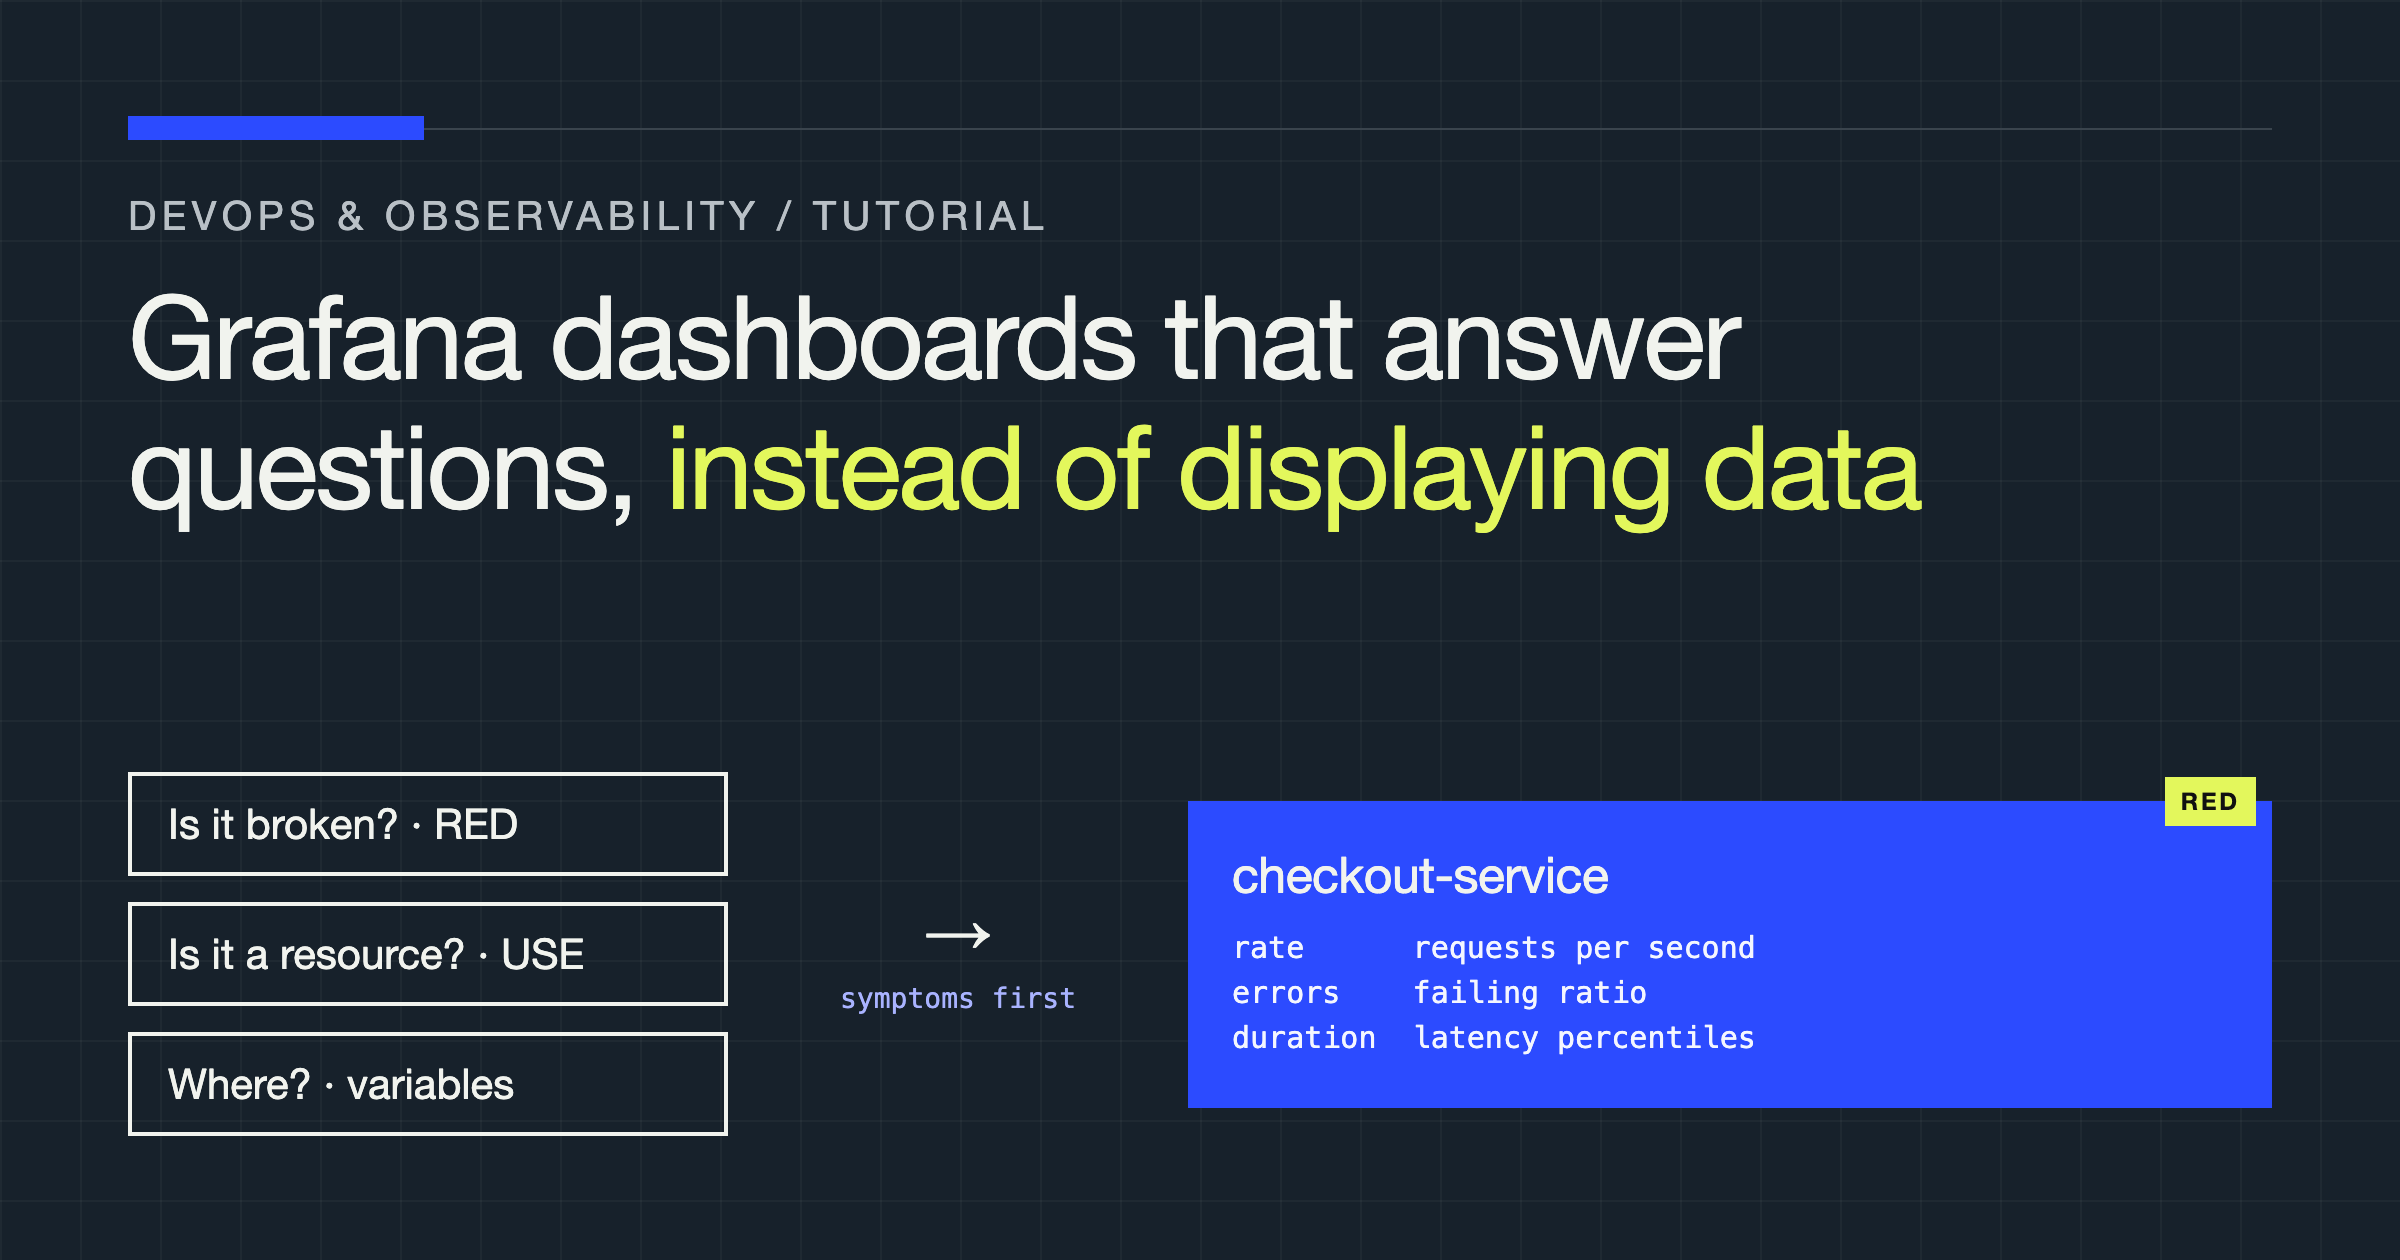
Grafana Dashboards That Answer Questions Instead of Displaying Data
Design Grafana dashboards around the questions operators actually ask: symptom-first layout, RED and USE panels, honest thresholds, and variables that narrow scope.
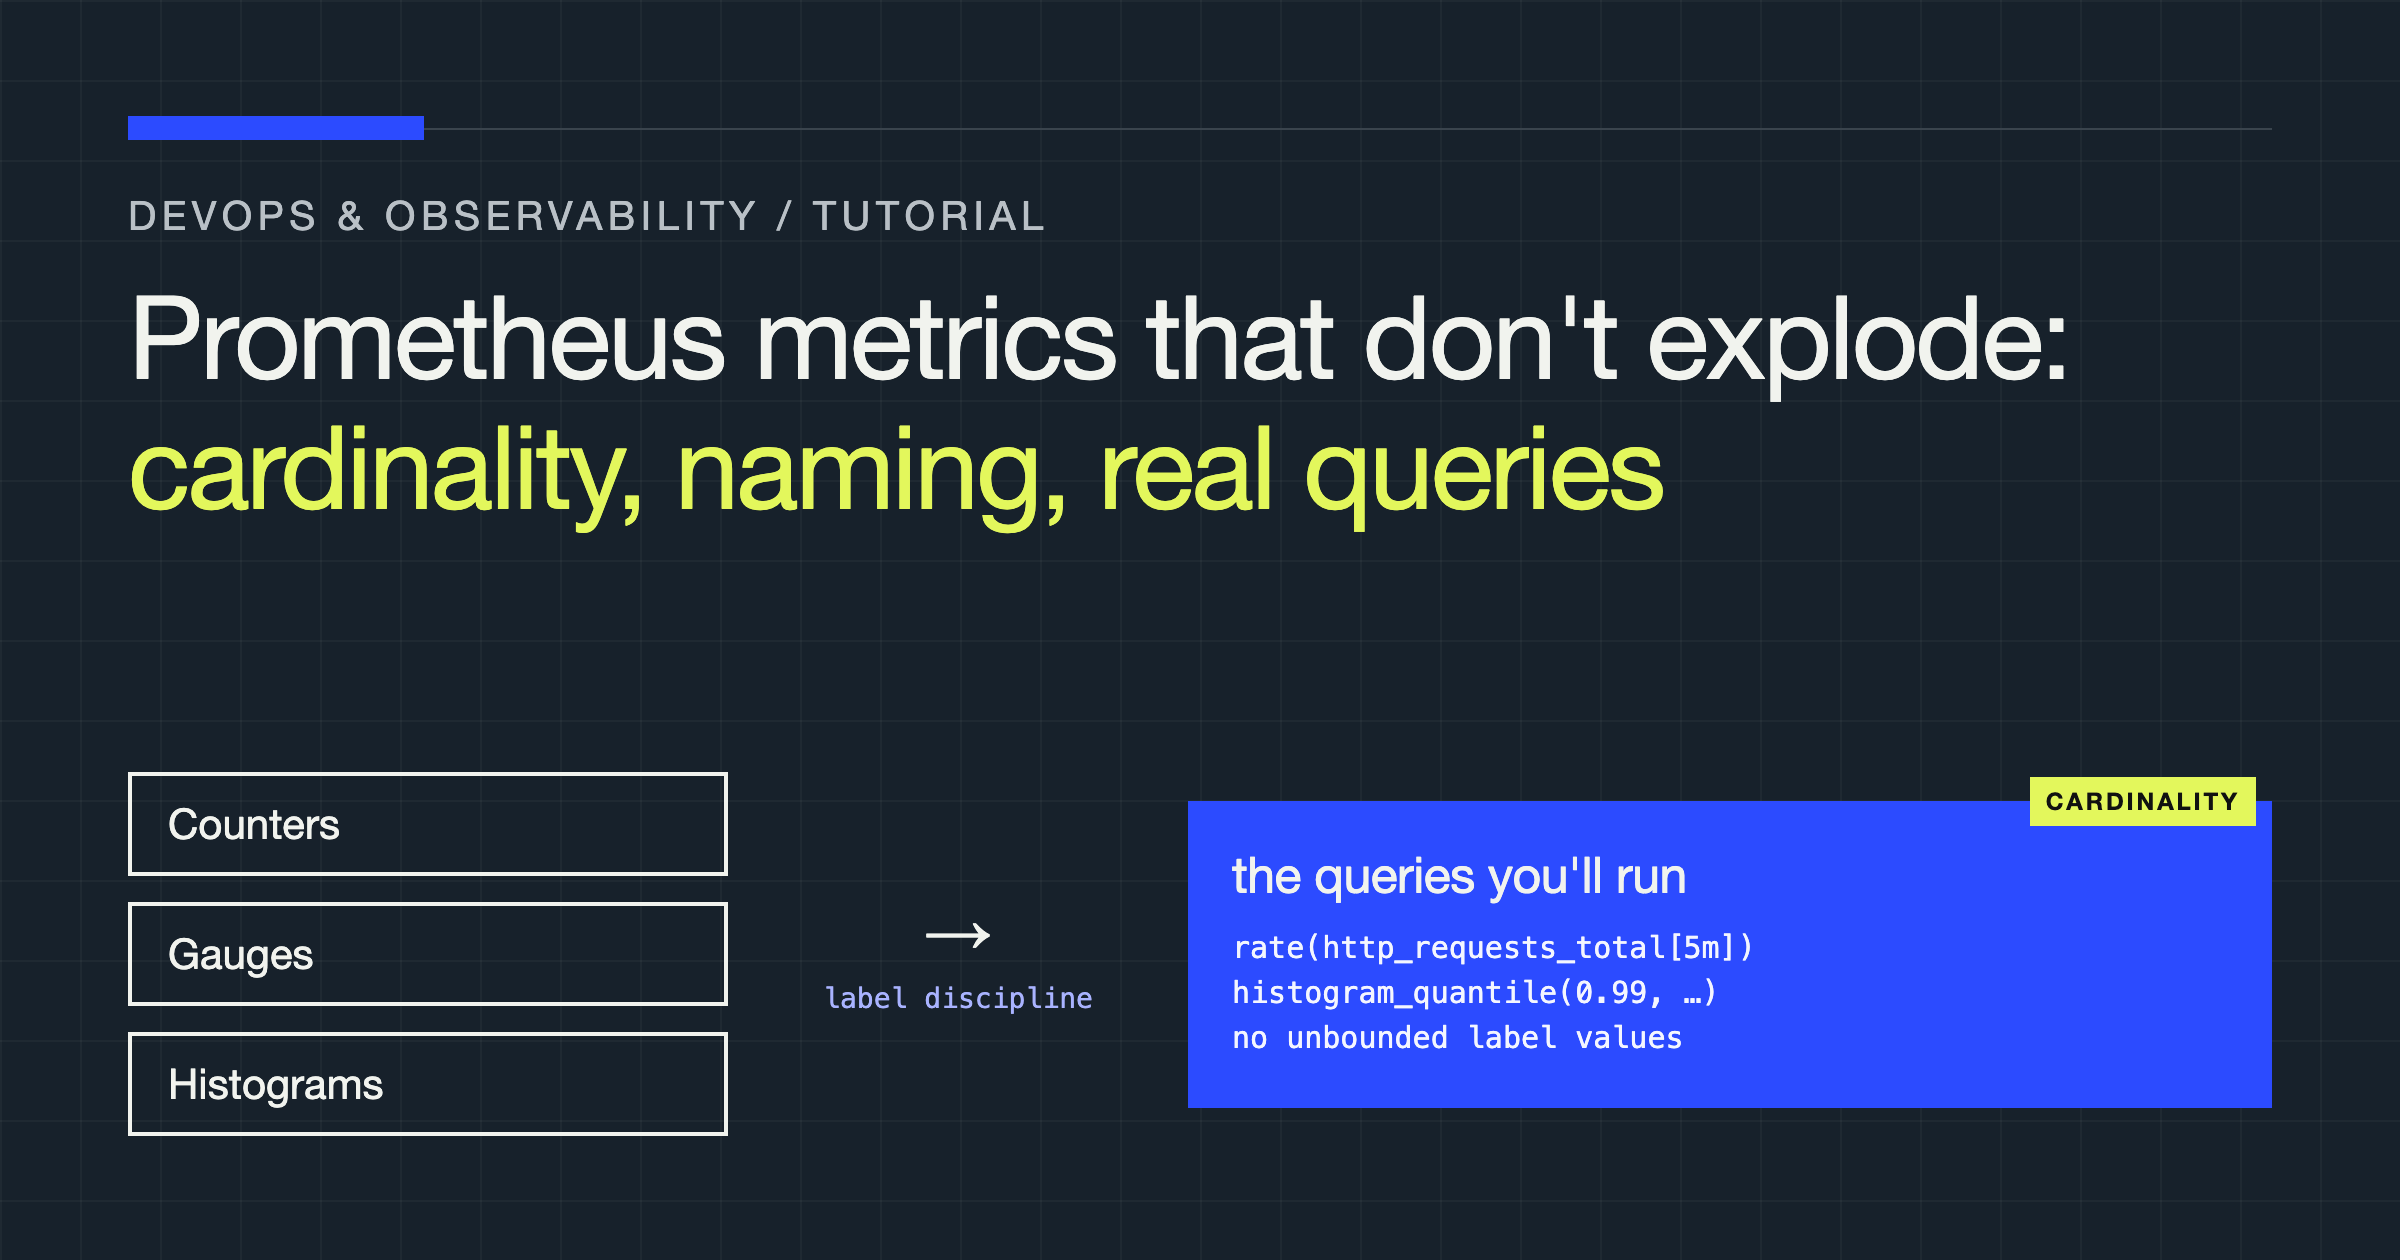
Prometheus Metrics That Don't Explode: Cardinality, Naming, and the Queries You'll Actually Run
Design Prometheus metrics that stay queryable under load: naming, label discipline, histograms, and the PromQL for errors, latency, and saturation.
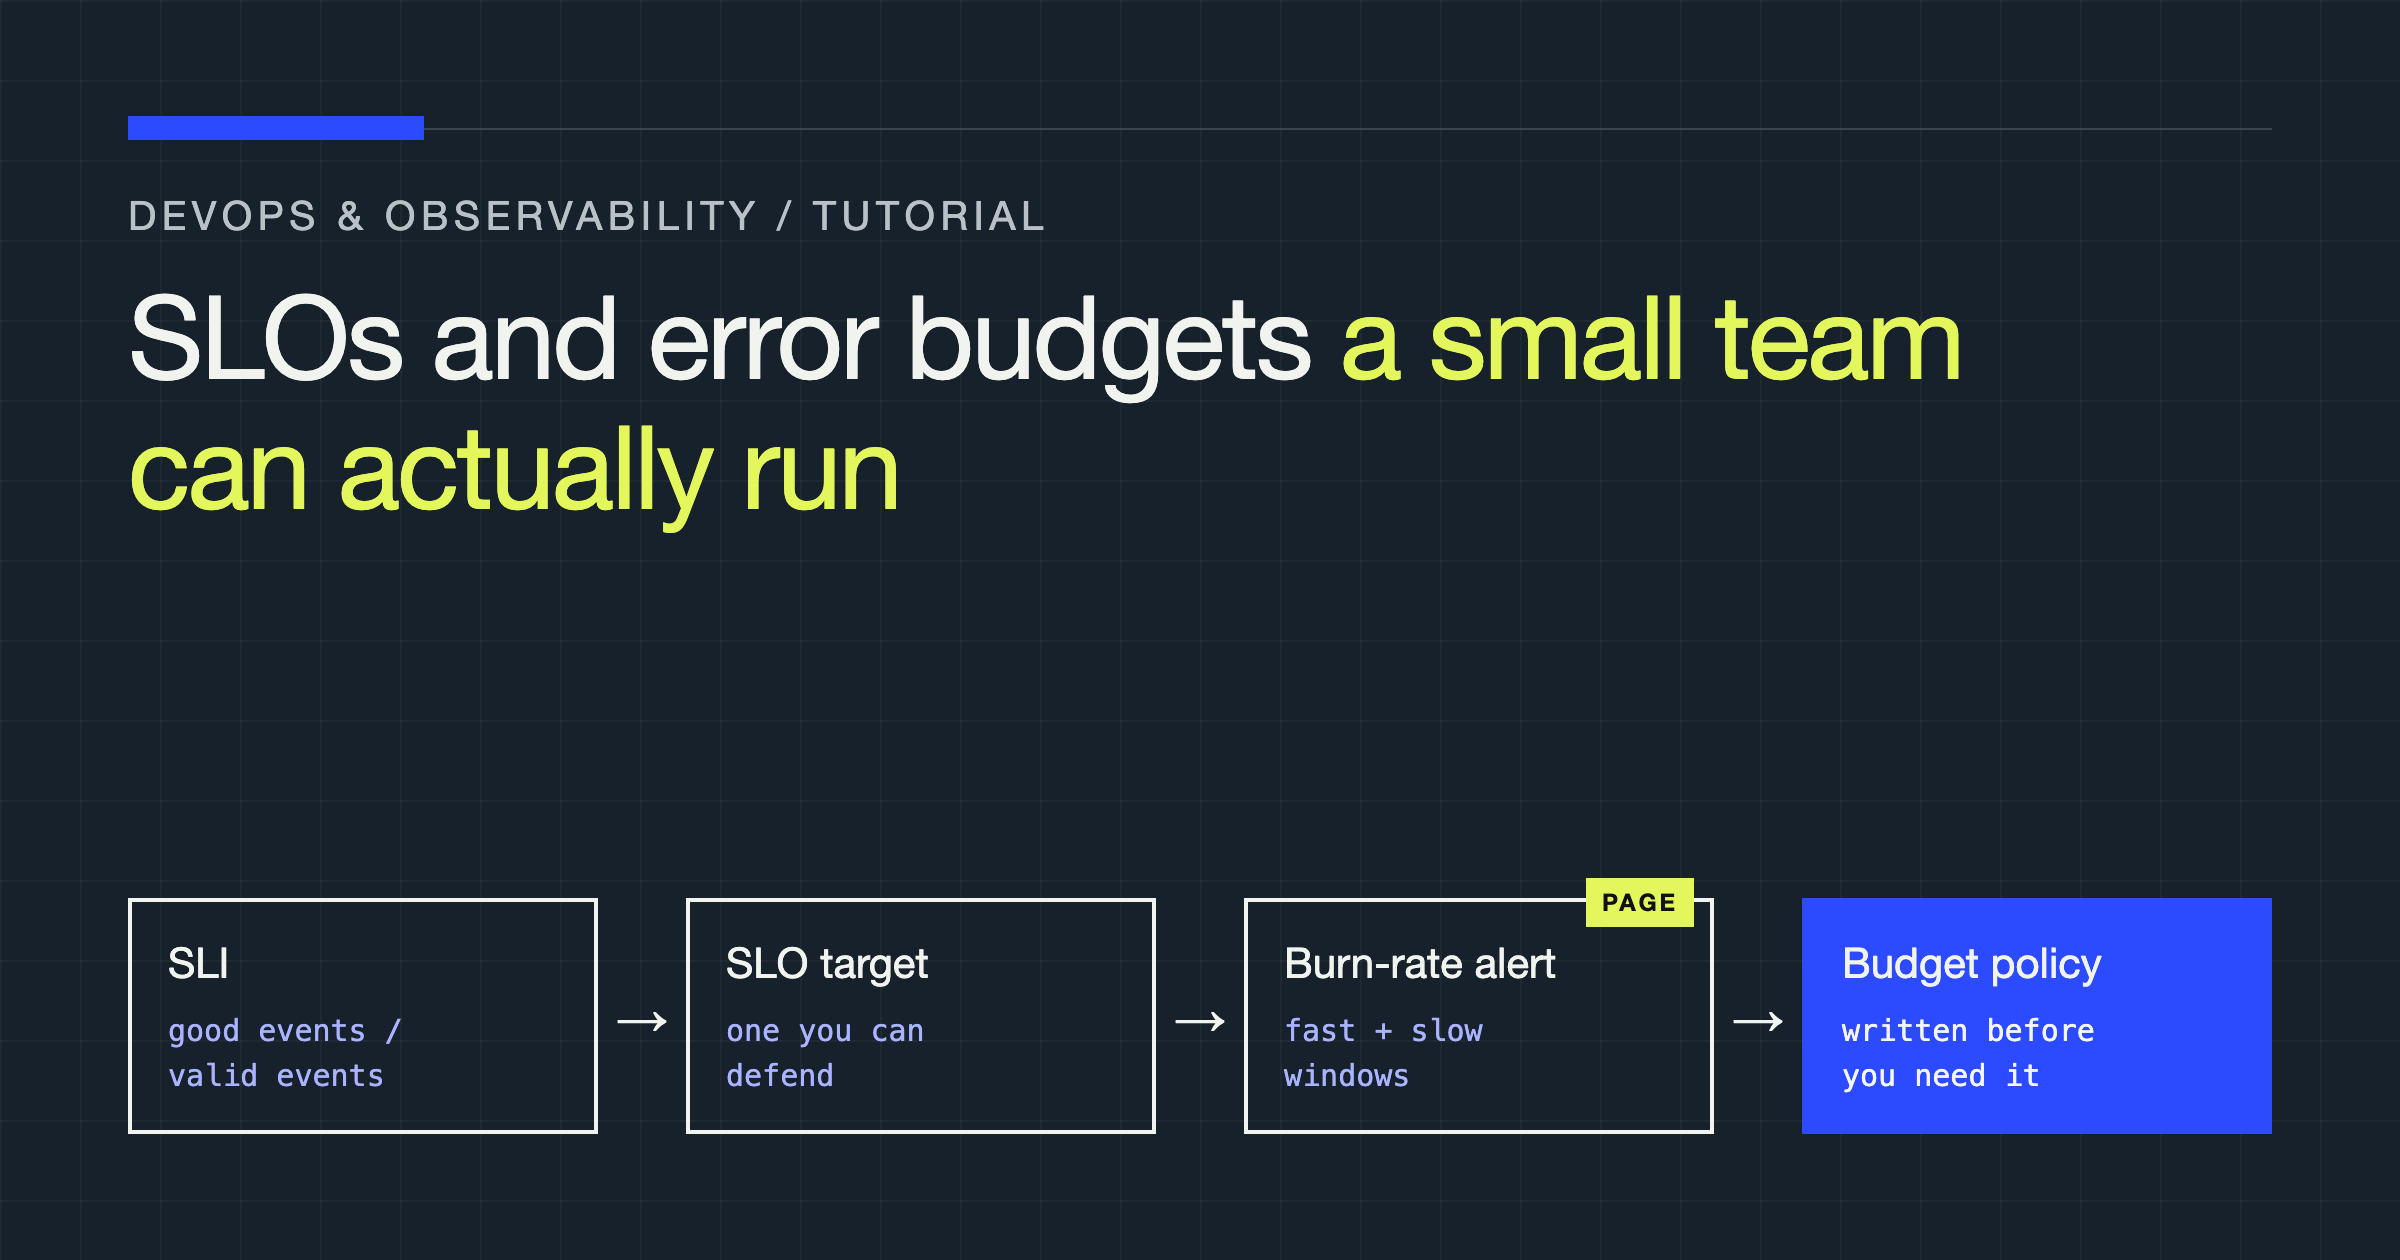
SLOs and Error Budgets a Small Team Can Actually Run
Build a lean SLO practice for a small team: pick few user-facing SLIs, set defensible targets, add burn-rate alerts, and enforce an error budget policy.
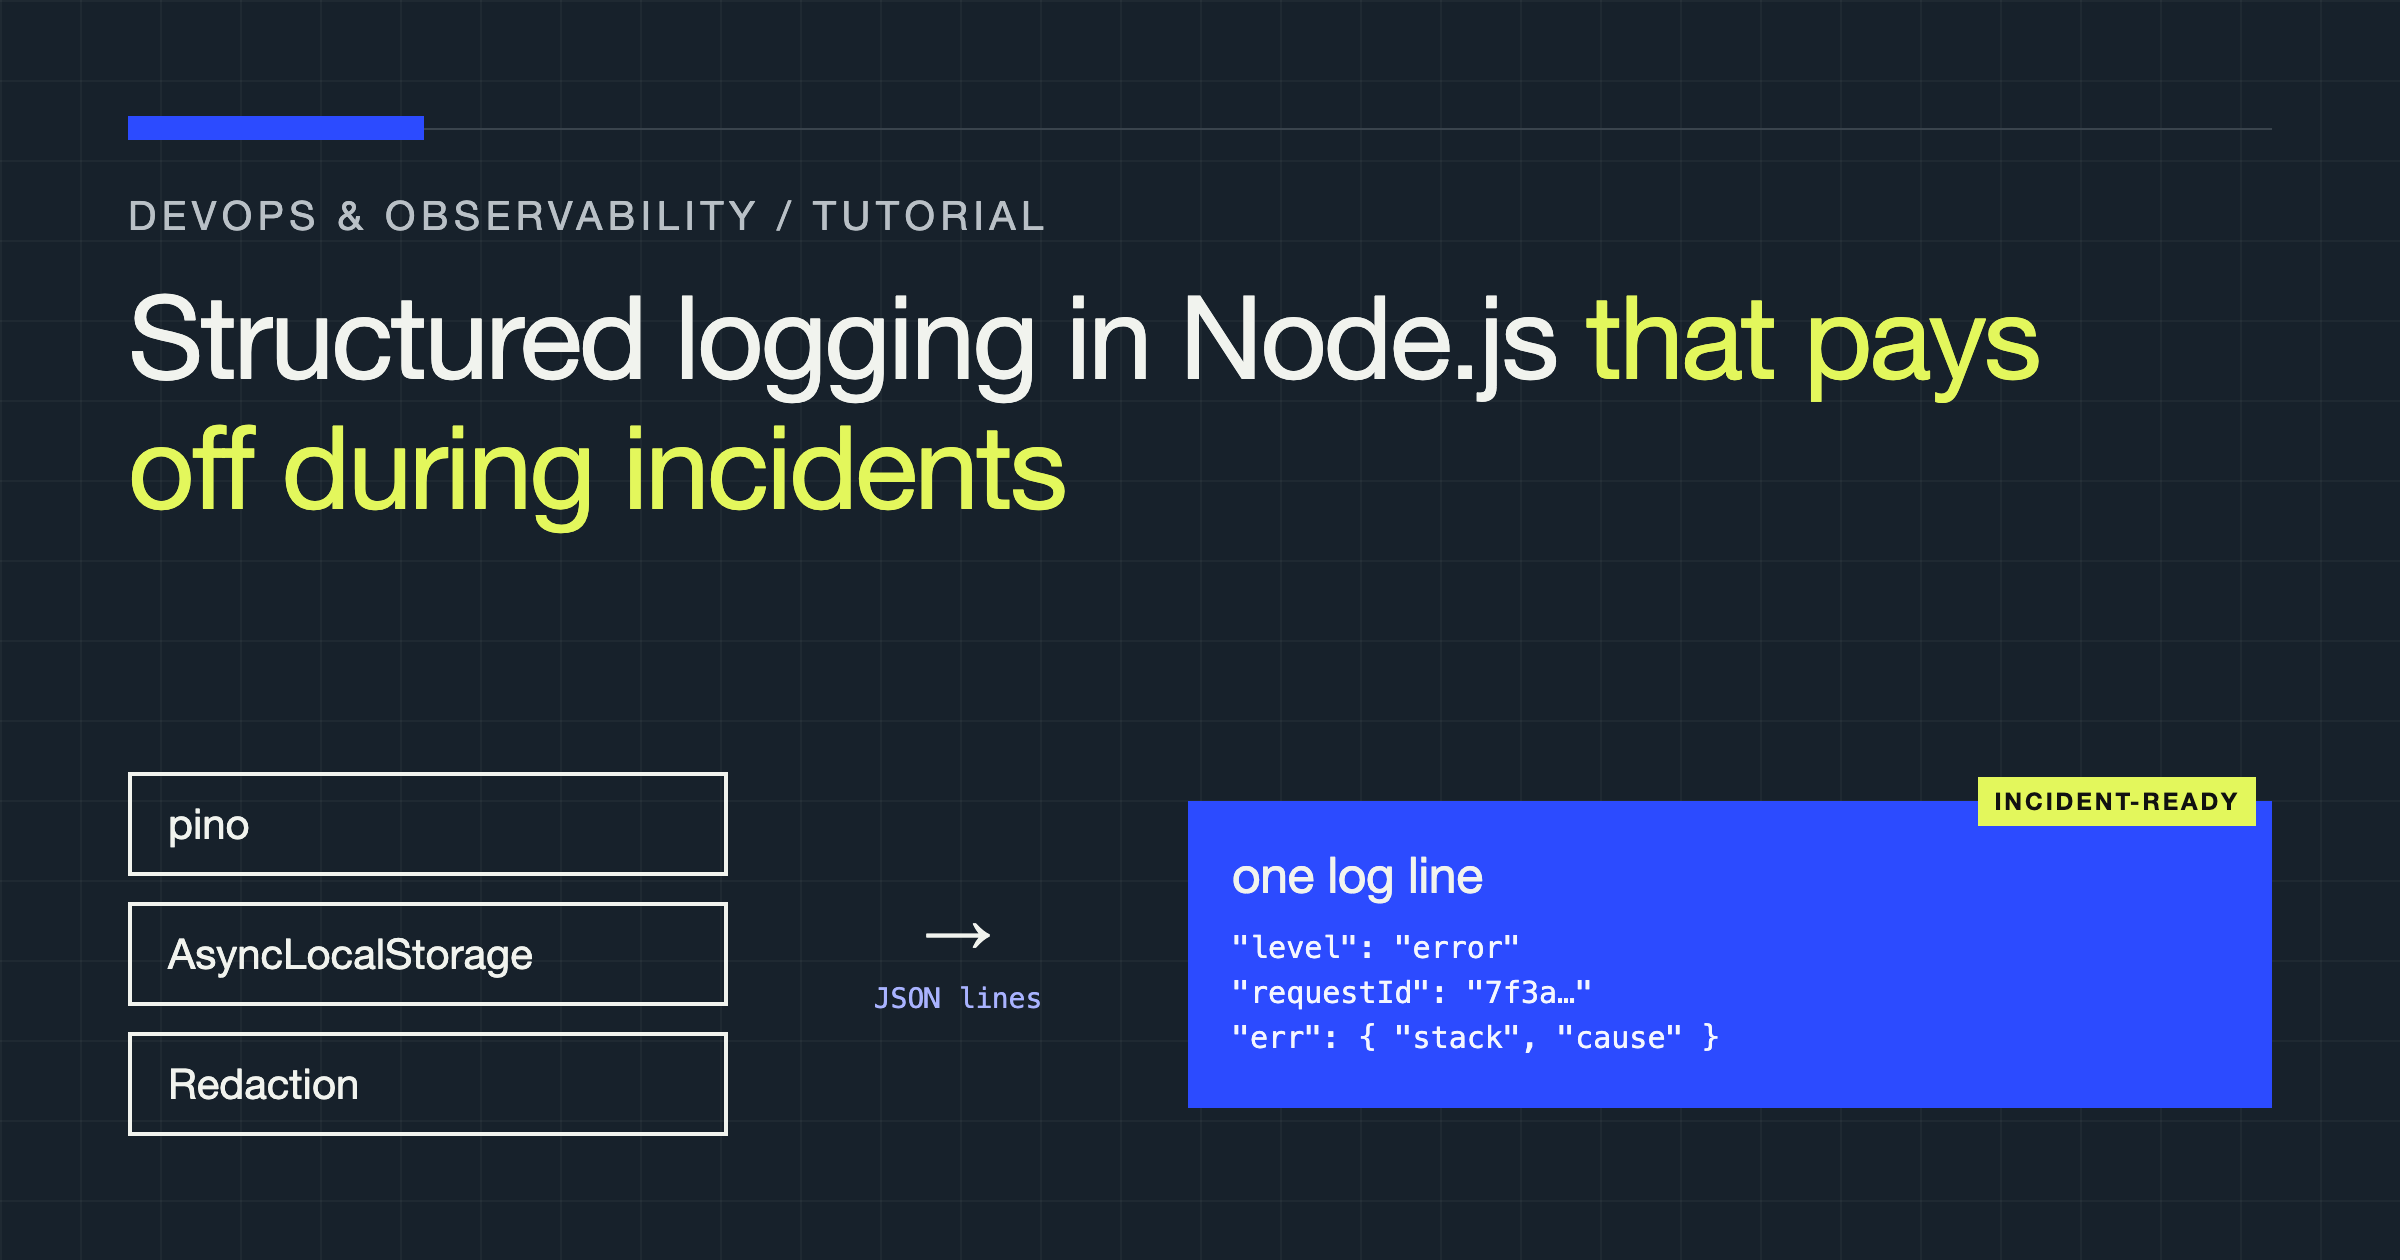
Structured Logging in Node.js That Pays Off During Incidents
Build structured JSON logging in Node.js with correlation IDs, redaction, and error serialization so you can trace failures quickly during incidents.
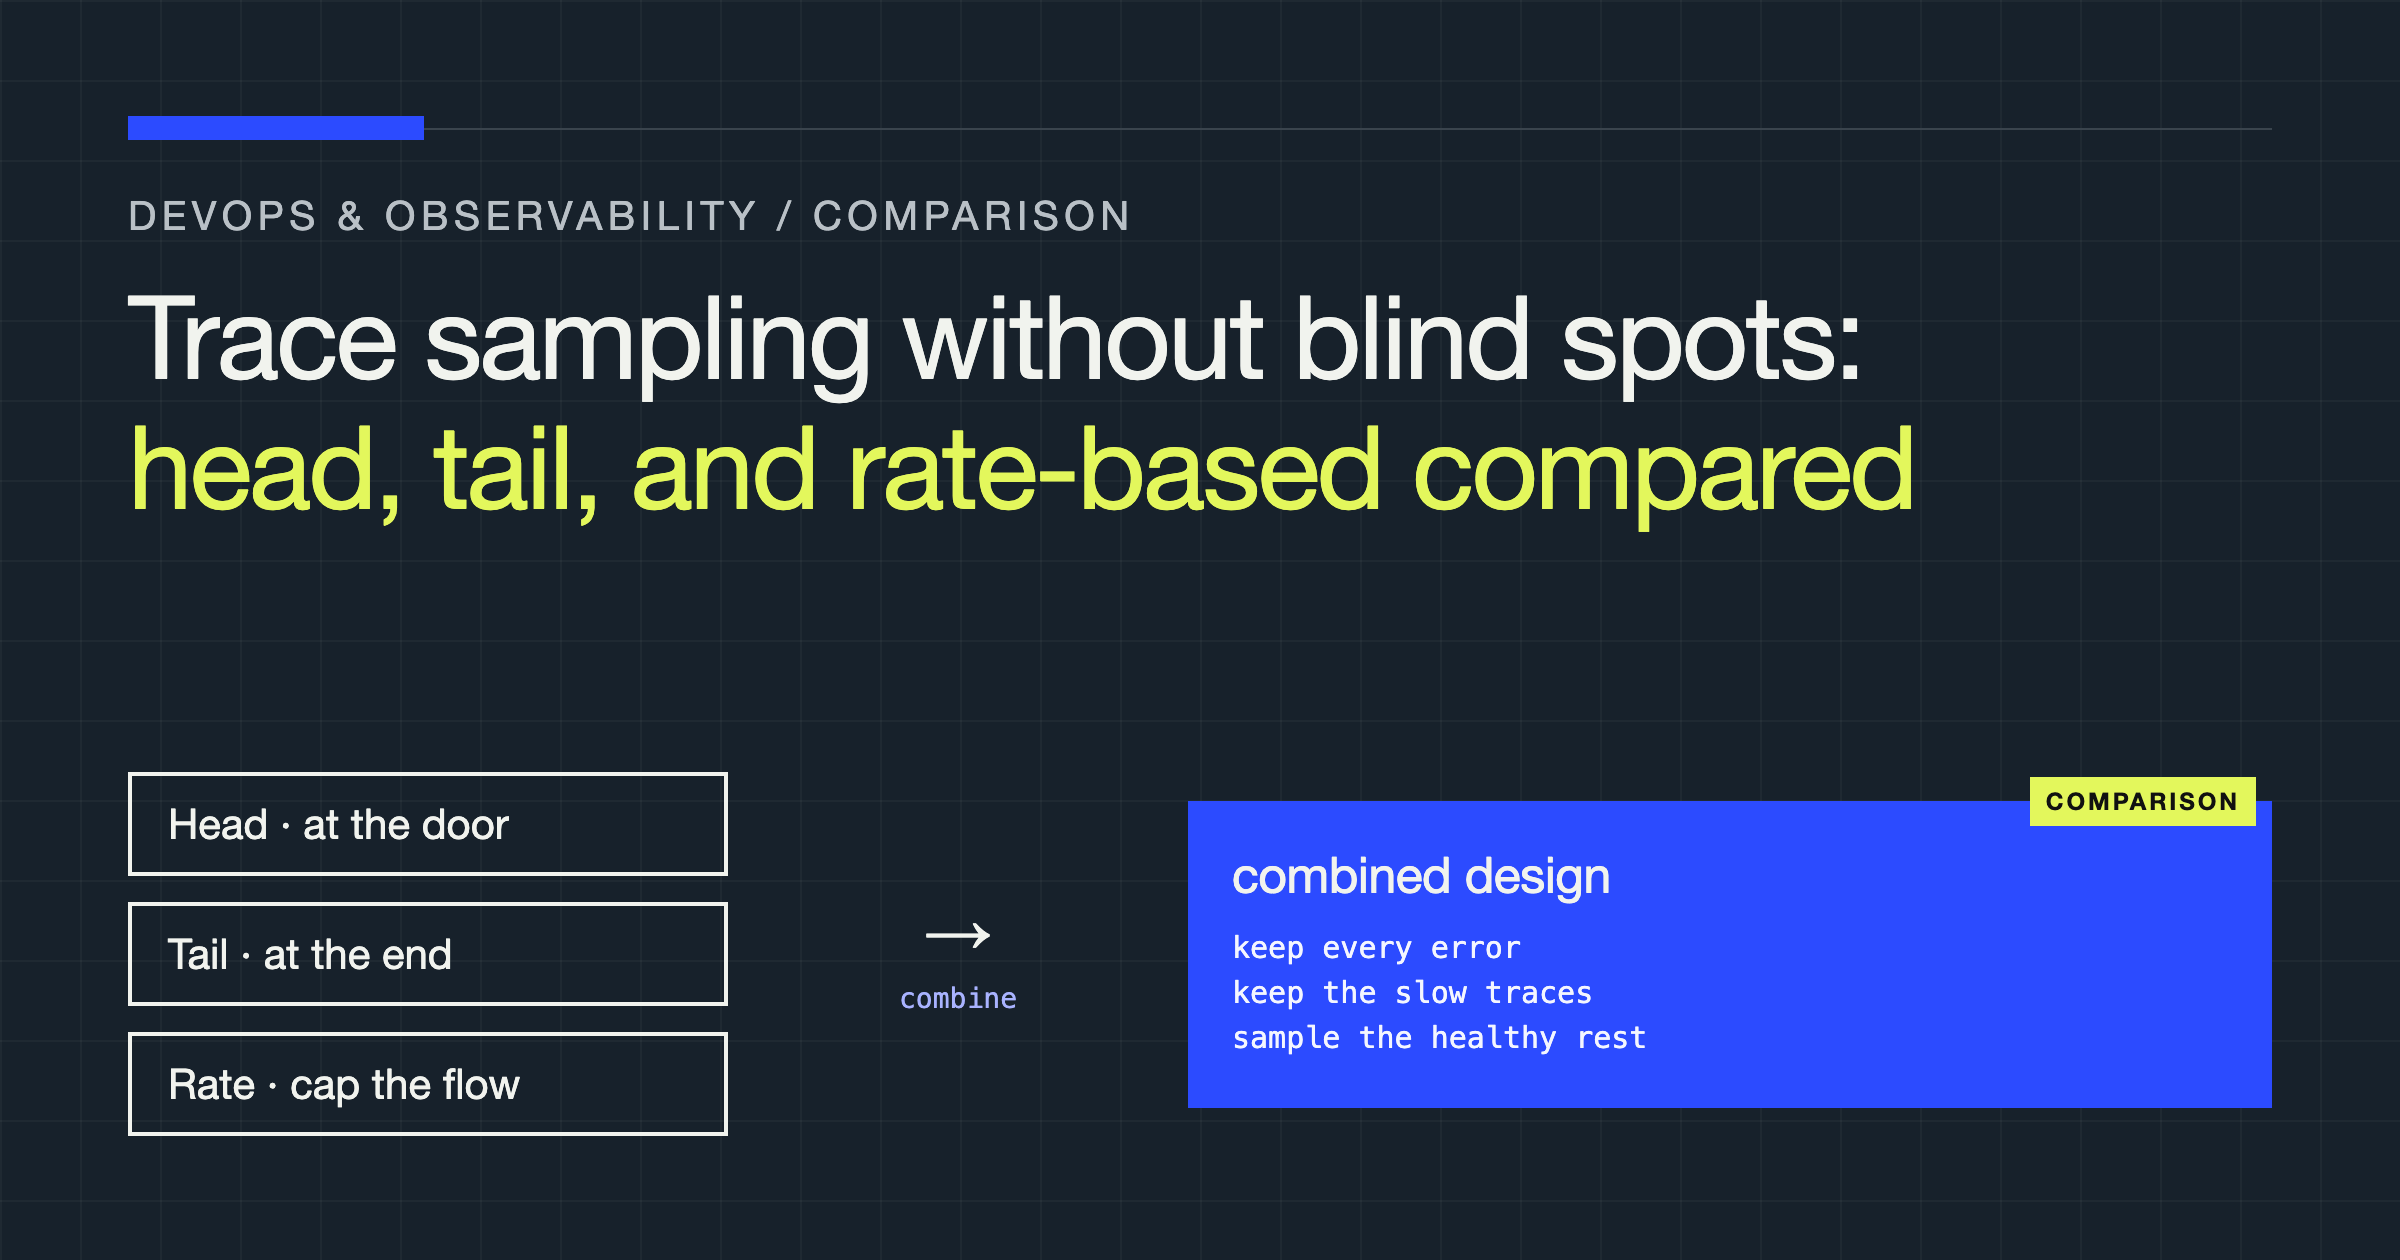
Trace Sampling Without Blind Spots: Head, Tail, and Rate-Based Strategies Compared
Compare head, tail, and rate-based trace sampling by what each keeps, what each silently drops, and how to combine them without losing the traces that matter.
No matches in this set.
Clear a filter or try another combination.