DevOps & observability / Comparison
Trace Sampling Without Blind Spots: Head, Tail, and Rate-Based Strategies Compared
Compare head, tail, and rate-based trace sampling by what each keeps, what each silently drops, and how to combine them without losing the traces that matter.
You will decide, by the end of this article, which sampling strategy fits each class of traffic you run, and you will know exactly what each strategy throws away before you commit to it. Sampling is the most consequential decision in a tracing pipeline because it is irreversible: a span you drop at collection time does not exist later, no matter how good your query interface is. Every other observability problem can be fixed after the fact. This one cannot.
Most teams pick a sampling rate the way they pick a log level: once, early, and by gut feeling. Then an incident happens, someone asks for the trace of a failing request, and the honest answer is that the trace was never kept. The sections below walk through the three strategies you will actually choose between, the failure modes each one creates, and a combined design that covers the gaps each strategy leaves on its own.
What sampling actually decides
A trace is a tree of spans that follows one request across services. Sampling is the decision, made per trace, about whether to keep and export that tree. The decision matters for three separate reasons, and teams routinely conflate them.
First, cost. Every kept span is stored, indexed, and retained, and that cost scales with traffic. Second, signal. Rare events are the ones you most want: the one request in ten thousand that hit an untested code path carries more diagnostic value than ten thousand healthy ones. Third, completeness. Some uses of tracing, such as reconstructing a customer-visible failure for a support ticket, need the specific trace, not a representative one. A strategy that is excellent on cost can be terrible on the third count, and you only find out during an incident.
Keep those three axes separate in your head as you read. There is no strategy that wins on all three, which is exactly why production systems end up combining them.
Head-based sampling: decide at the door
Head-based sampling makes the keep-or-drop decision when the trace begins, before any span completes. The root service flips a weighted coin, records the decision in the trace context, and every downstream service honours it. In OpenTelemetry you get this from samplers such as ParentBasedSampler wrapping a TraceIdRatioBasedSampler, and the decision propagates through the traceparent header so the whole tree shares one fate.
receivers:
  otlp:
    protocols:
      grpc:
      http:

processors:
  probabilistic_sampler:
    sampling_percentage: 10

exporters:
  otlp:
    endpoint: "backend.example.com:4317"

service:
  pipelines:
    traces:
      receivers: [otlp]
      processors: [probabilistic_sampler]
      exporters: [otlp]
The strengths are real: the decision is cheap, it happens before resources are spent, and it is perfectly consistent across the trace. If the coin says keep, you get the complete tree; if it says drop, no service wastes effort exporting spans nobody will store.
The blind spot is structural. A head sampler decides before it knows anything about the outcome. It cannot prefer error traces, slow traces, or traces from a newly deployed version, because none of that information exists yet at the root span. At a ten percent sampling rate, a failure that occurs once in ten thousand requests will be captured only by luck. You will have beautiful, representative traces of your system working correctly and almost no traces of it failing in the specific way you are paged for.
There are two standard mitigations. You can sample errors at a higher rate only if the error is knowable at the edge, which it usually is not for downstream failures. Or you can accept head sampling for what it is good at, a statistically honest picture of normal behaviour, and pair it with something smarter for the interesting cases. That pairing is where tail sampling comes in.
Tail-based sampling: decide after the story ends
Tail-based sampling inverts the timing. Spans are collected and buffered, the trace is allowed to complete (or age past a decision window), and only then does the collector decide whether the assembled trace is worth keeping. Because the decision happens with the full trace in view, your policies can use outcome data: keep every trace containing an error status, keep traces slower than a latency threshold, keep traces from a specific route or tenant, and sample the healthy remainder at a low rate.
In the OpenTelemetry Collector this is the tail_sampling processor, and it usually sits in a collector tier that receives spans from your services:
processors:
  tail_sampling:
    decision_wait: 30s
    num_traces: 100000
    expected_new_traces_per_sec: 1000
    policies:
      - name: keep-errors
        type: status_code
        status_code:
          status_codes: [ERROR]
      - name: keep-slow
        type: latency
        latency:
          threshold_ms: 2000
      - name: baseline
        type: probabilistic
        probabilistic:
          sampling_percentage: 5
Tail sampling fixes the head sampler’s blind spot directly. Errors and outliers are kept by policy, not by luck. For incident investigation it is close to ideal: the traces you reach for are the traces you have.
The costs are operational, and they are not small. Buffering traces means the collector holds state, and that state is per-trace: every span belonging to one trace must reach the same collector instance for the policy to see the assembled tree. That forces trace-ID-based load balancing in front of the tail tier, which is one more component to run well. The buffer also has hard limits. If traffic spikes, num_traces fills and the collector starts evicting, and eviction under pressure can drop exactly the traces generated by the overload you are trying to observe. The decision_wait window creates a second edge case: a long-running trace, a batch job or a websocket session whose spans arrive over minutes, will be decided before it finishes, and late spans of a kept trace can arrive after the decision and be handled inconsistently. You need to know how your collector treats late spans and choose the window deliberately rather than accepting a default.
Memory pressure is the third constraint. Each buffered trace occupies memory until its decision, so the tail tier’s footprint scales with traffic rate multiplied by decision wait. Size it from your real span volume, not from optimism, and alert on its saturation the way you would alert on any queue you depend on.
Rate-based sampling: cap the flow, not the fraction
Rate-based sampling, usually expressed as a rate-limiting policy, answers a different question. Instead of keeping a fixed fraction of traces, it keeps up to a fixed number of traces per second and drops the excess. In the collector, the tail sampling processor offers a rate_limiting policy type; other pipelines implement the same idea with a limiting processor in front of export.
The appeal is predictability. A percentage sampler has a cost that scales with your traffic, so your observability bill spikes exactly when your traffic does, including during the load event you are investigating. A rate cap inverts that: storage and ingest cost stay roughly flat, and what degrades under load is the sampling fraction, which falls as traffic rises.
The blind spot is the mirror image of the head sampler’s. During a traffic surge, often the exact moment of an incident, your effective sampling rate collapses, so the rare error trace competes with a flood of ordinary traces for a fixed number of slots. Rate limiting alone also has no opinion about which traces matter; it is a budget control, not a selection strategy. Treat it as the outer guardrail of a pipeline rather than the pipeline’s intelligence.
The three strategies side by side
| Strategy | When it decides | What it keeps well | What it drops | Operational cost |
|---|---|---|---|---|
| Head-based | At trace start | A consistent, representative slice of all traffic | Rare errors and slow outliers, by chance | Lowest; stateless and simple |
| Tail-based | After trace completes | Errors, slow traces, policy-matched traces | Traces evicted under buffer pressure; very long traces | Highest; stateful, needs trace-aware routing |
| Rate-based | Continuously, against a budget | A bounded, predictable volume | Whatever exceeds the cap during surges | Low to moderate; no selection intelligence |
Read the middle column against your actual use of tracing. If your traces exist mainly for service-level trends and dependency maps, head sampling’s representative slice is genuinely sufficient. If your traces exist so an engineer can open the specific failing request during an incident, representative is a polite word for inadequate, and you need outcome-aware selection.
A combined design that covers the gaps
The design that holds up in practice layers the strategies by traffic class rather than picking one winner.
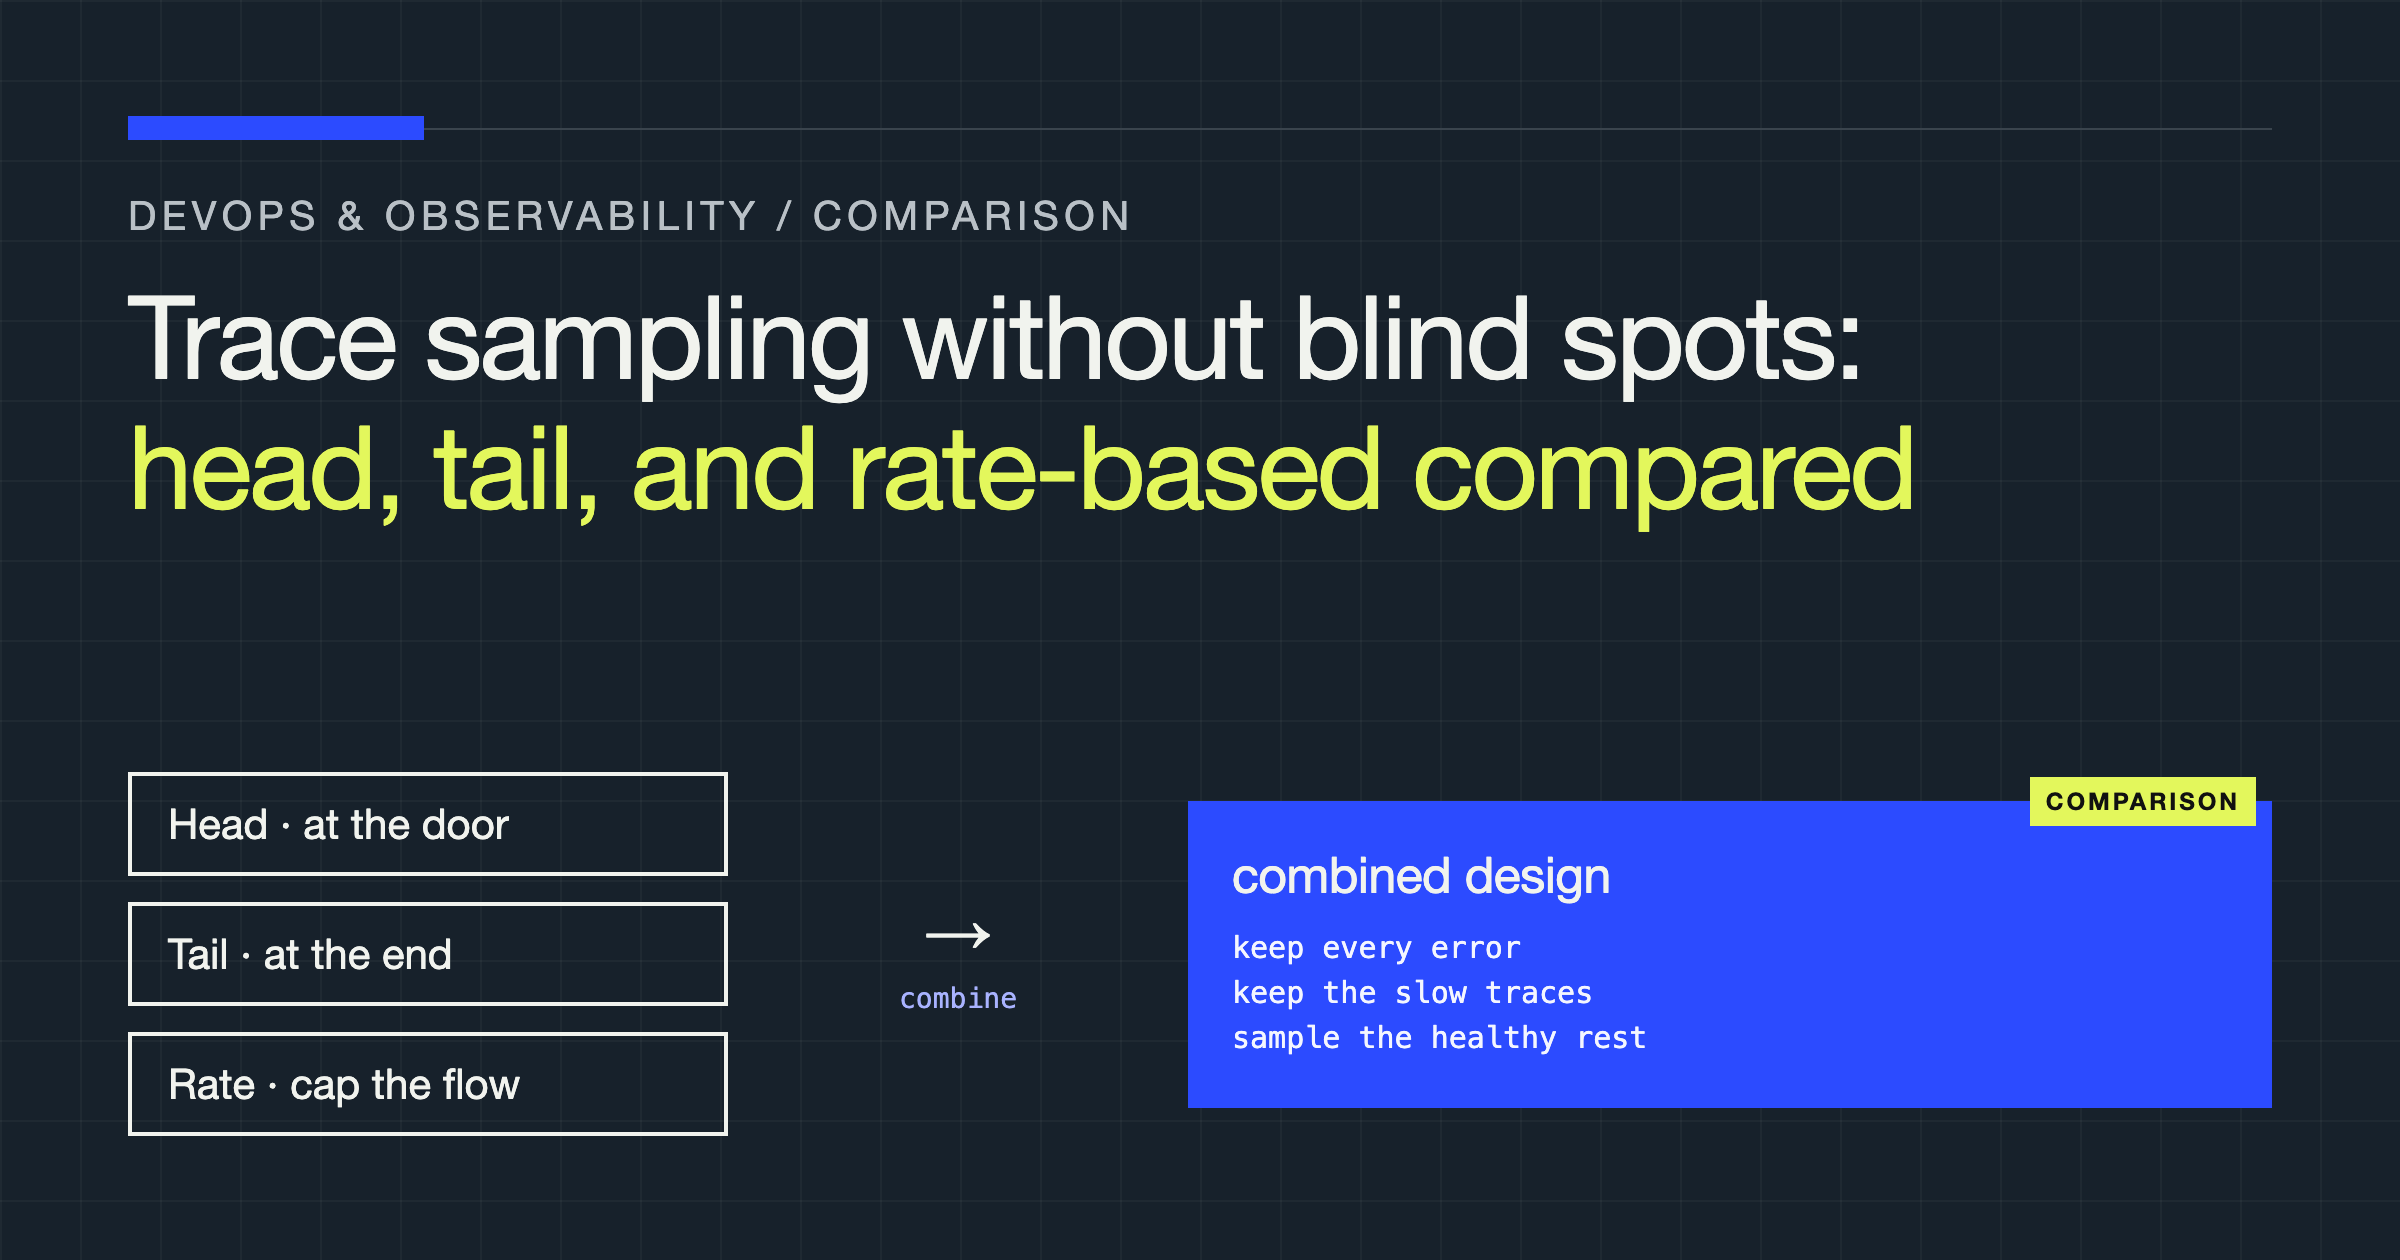
Start with tail sampling as the primary mechanism on your main request path, with policies ordered deliberately: errors first, then latency outliers, then any routes you are actively changing, such as a service mid-rollout, and a low probabilistic baseline beneath them for normal traffic. Policies in the tail sampler are evaluated against the whole trace, so ordering reflects what you value when you cannot keep everything.
Put a rate cap around the result as a budget guardrail, so a traffic event cannot turn your observability pipeline into a second incident. Size the cap from what you are willing to store, and treat hitting it as a signal worth alerting on, not as silent behaviour.
Keep head sampling at the SDK level only where it earns its place: extremely high-volume, low-value internal traffic, health checks, polling endpoints, background retries, where dropping most traces at the source saves real network and CPU cost and the traces carry little diagnostic value even when complete. Excluding health checks and synthetic probes from tracing entirely is often the better version of the same decision.
Two supporting practices matter as much as the strategy choice. First, record your sampling decisions observably: emit metrics on traces received, kept, and dropped per policy, so a blind spot shows up as data instead of as an absence discovered later. Second, propagate the sampled flag honestly and keep unsampled traces cheap but not invisible; span events and error recording at the edge can preserve a minimal record of failures even for traces you do not export in full, depending on your instrumentation.
Tradeoffs you cannot design away
Be clear-eyed about three things. Tail sampling’s quality depends on your routing discipline: one service bypassing the tail tier quietly reintroduces blind spots, so make the path structural rather than conventional. Buffering adds latency to trace availability, so traces appear in your backend after the decision window rather than immediately; for live debugging during an incident that delay is a real, if acceptable, cost. And every strategy interacts with your retention and indexing costs downstream, so a sampling change is a budget change and should be reviewed like one.
Verdict
If you run one strategy only, run tail-based sampling with explicit error and latency policies over a small probabilistic baseline: it is the only single choice that guarantees the traces you need during an incident are the traces you kept. Add a rate cap as soon as traffic growth makes your tracing bill unpredictable, and reserve head sampling for the high-volume, low-value traffic where dropping at the source is the honest optimisation. Then instrument the sampler itself, because the most dangerous sampling configuration is the one whose blind spots nobody can see.