DevOps & observability / Tutorial
Grafana Dashboards That Answer Questions Instead of Displaying Data
Design Grafana dashboards around the questions operators actually ask: symptom-first layout, RED and USE panels, honest thresholds, and variables that narrow scope.
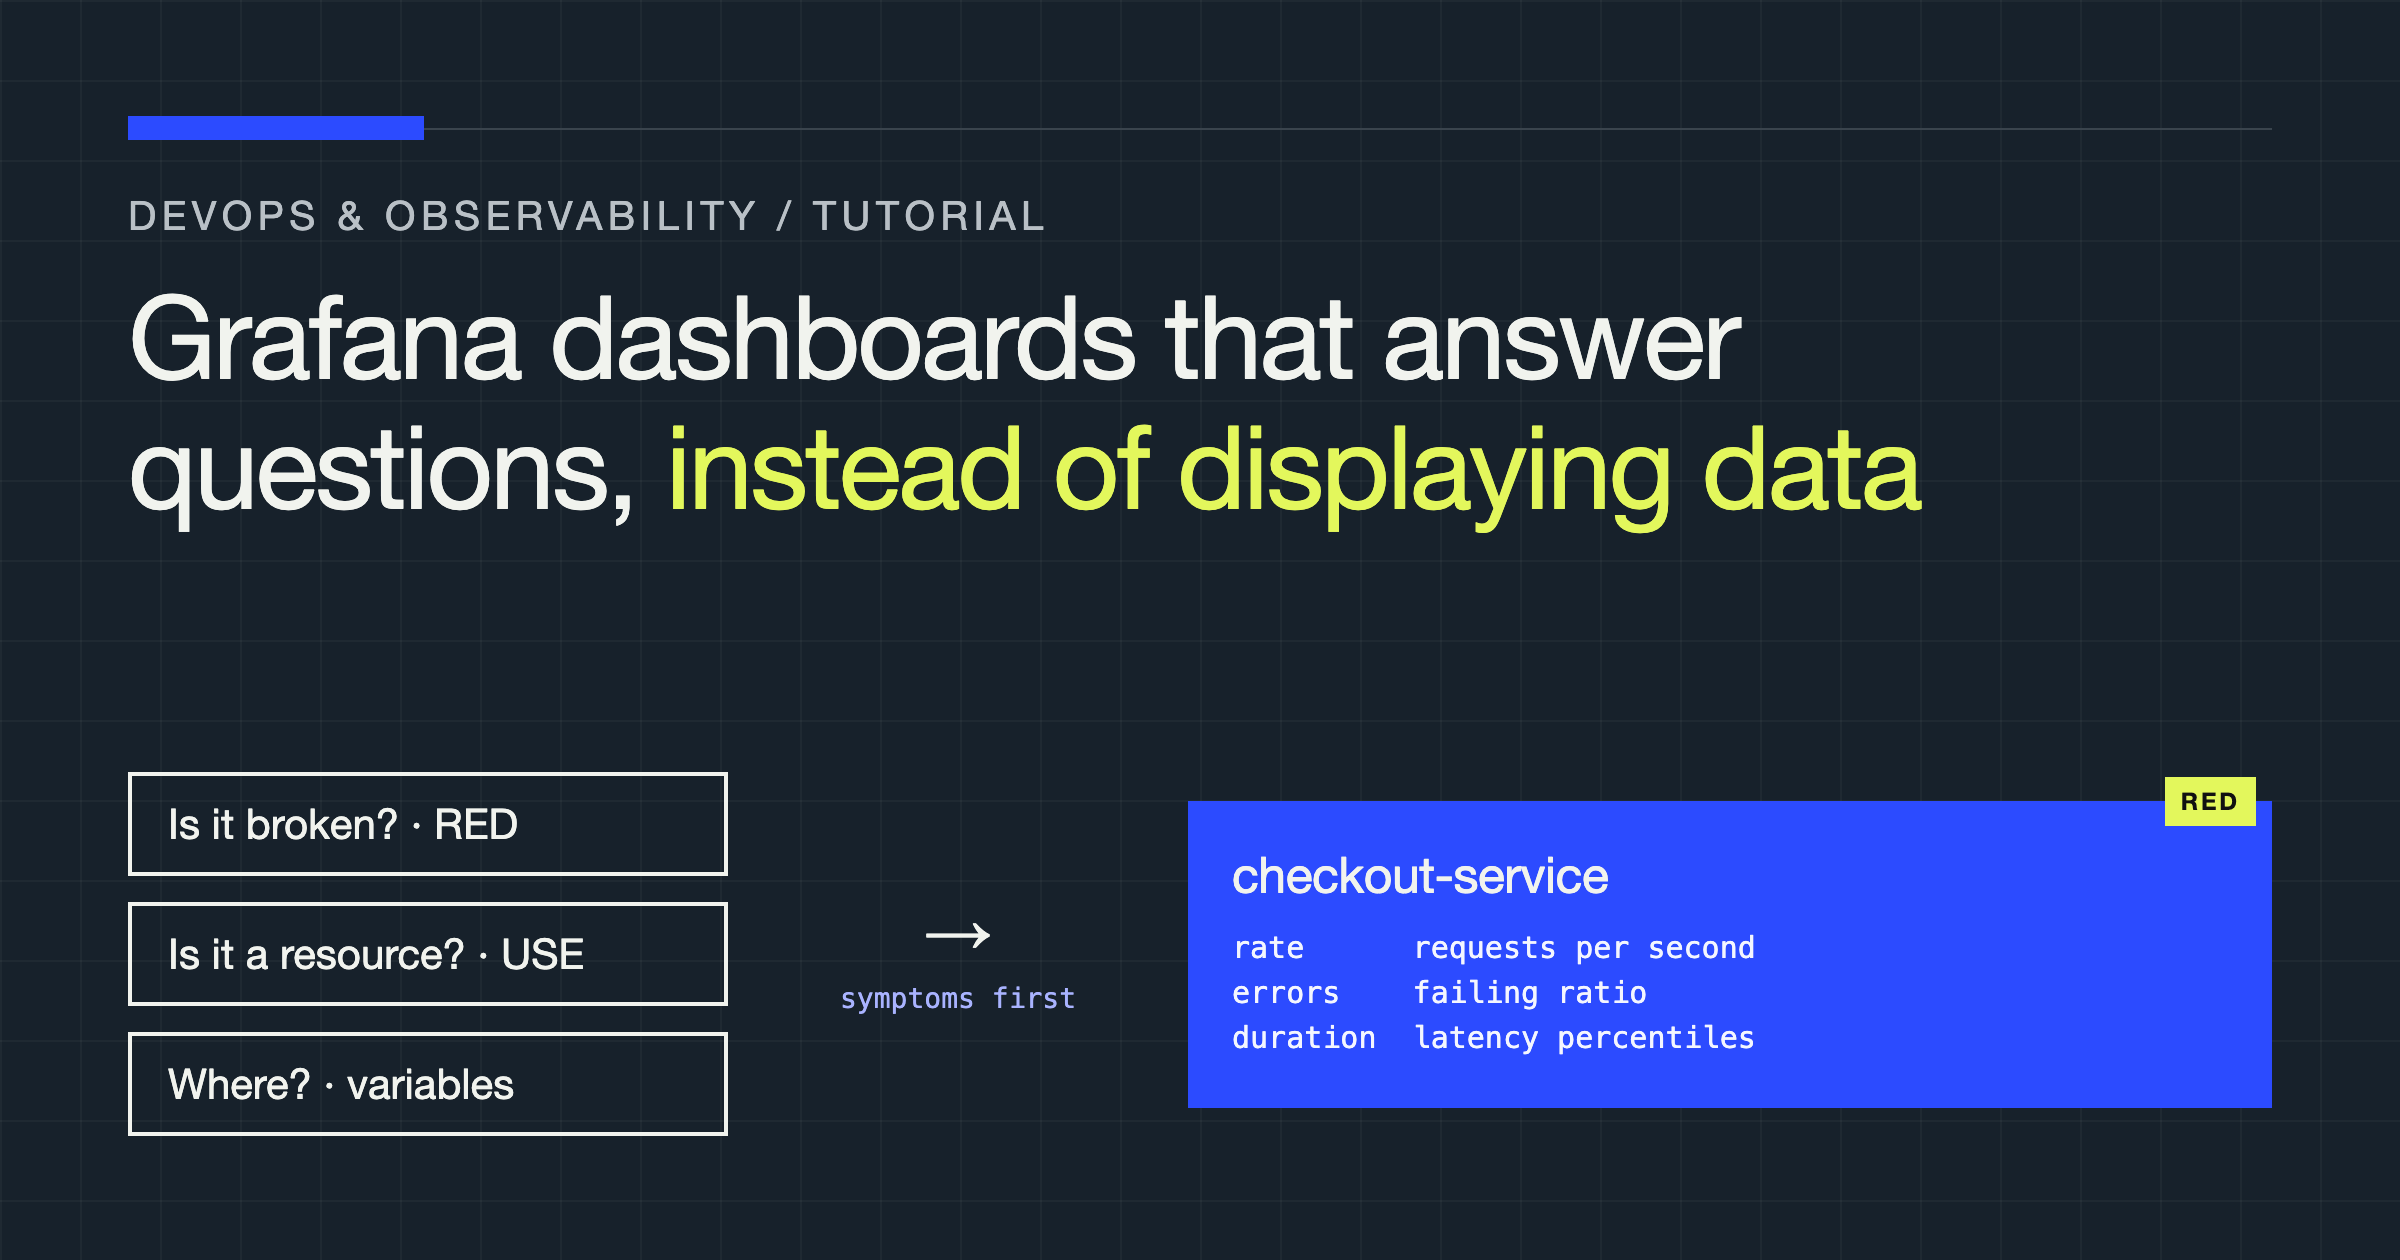
You will rebuild a typical service dashboard in this tutorial, and the rebuild starts by throwing away its organising principle. Most dashboards are organised by data source: a row for the application, a row for the database, a row for the hosts, every metric someone once found interesting, arranged in the order it was added. That structure answers a question nobody asks during an incident, which is “what metrics do we collect?” The dashboard you will build is organised by the questions an operator actually brings to it, in the order they ask them, and every panel has to earn its place by answering one.
The examples use Grafana with Prometheus, but the design rules are tool-agnostic: they concern what a panel claims, how it is arranged, and when it should be deleted, and those questions survive any migration between observability vendors.
Write the questions down before you open the editor
A service dashboard serves three visits, and they have different needs. The first visit is triage: something is wrong, possibly with this service, and the operator needs to know within seconds whether the service is the problem and how badly users are affected. The second visit is diagnosis: the service is implicated, and the operator is narrowing from symptom to cause. The third visit is review: after the fact, someone is reconstructing what happened, or checking whether a change improved things.
List the literal questions for your service before touching a panel. For a typical request-serving API they look like this:
| Visit | Question | Panel that answers it |
|---|---|---|
| Triage | Are users seeing errors right now? | Error rate as a proportion of requests, with the alert threshold drawn on it |
| Triage | Is it slow, or is it down? | Request rate beside error rate, latency percentiles beside both |
| Diagnosis | Is the problem ours or a dependency’s? | Per-dependency error and latency panels for each downstream call |
| Diagnosis | Did something change? | Deploy annotations on every time series, aligned to the same time axis |
| Review | Is this week worse than last week? | A comparison view with the same panels over a shifted time range |
If a panel on your current dashboard answers no question on a list like this, it is not neutral. It costs loading time, screen space, and attention during exactly the visits where attention is scarcest. Delete it, or move it to a detail dashboard linked from the main one.
Lead with symptoms: the RED row
For request-driven services, the top row of the dashboard should be the RED signals: rate, errors, and duration. Rate is requests per second, errors is the proportion of requests failing, and duration is the latency distribution, shown as percentiles rather than an average. These three panels, sharing one time axis at the top of the dashboard, answer the triage questions without scrolling, and their relative shapes tell the first story: errors rising while rate holds steady is a different incident from errors rising because rate collapsed.
# Request rate
sum(rate(http_requests_total{service="checkout"}[5m]))

# Error proportion (not raw error count)
sum(rate(http_requests_total{service="checkout", status=~"5.."}[5m]))
  /
sum(rate(http_requests_total{service="checkout"}[5m]))

# Latency percentiles
histogram_quantile(0.95,
  sum(rate(http_request_duration_seconds_bucket{service="checkout"}[5m])) by (le))
Two of those queries encode design decisions worth stating. Errors are expressed as a proportion of requests, because a raw error count doubles whenever traffic doubles and tells you nothing about user impact; the proportion is the number an alert threshold can honestly be set against. And latency is a percentile computed from histogram buckets, because an average latency hides exactly the tail your users complain about. Averages also fail arithmetically in a subtle way: you cannot average percentiles across instances after the fact, but the histogram lets Prometheus compute the true percentile across the fleet at query time, which is the second reason to instrument durations as histograms rather than summaries when a dashboard is the consumer.
Answer “is it the resource?” with USE
Below the symptom row, arrange the resource panels by the USE pattern: utilisation, saturation, and errors, for each resource the service depends on. Utilisation is how busy the resource is, saturation is how much work is waiting because the resource cannot take more, and errors are the resource’s own failures. Saturation is the panel teams forget and the one that predicts incidents: a connection pool with a growing queue, a thread pool at its limit with requests waiting, a disk whose utilisation looks moderate while its queue lengthens. Latency in the RED row plus saturation in the USE row usually brackets a cause before you open a single log line.
Keep the resource list honest and short: the service’s own CPU and memory, its primary datastore, and each downstream dependency that can take it down. Dependencies get the same treatment from the caller’s side, per-dependency rate, error proportion, and latency, because “the database is slow” and “our calls to the database are slow” are different claims with different owners, and the dashboard should be able to make the second one precisely.
Thresholds, annotations, and the discipline of the time axis
A panel without its alert threshold drawn on it forces the operator to hold the threshold in memory, the same design error as a runbook without expected values. Where a metric has an alert, render the threshold line on the panel, and keep the two in agreement; a dashboard that shows a service comfortably below a line that is not the alerting line manufactures false calm or false alarm. Colour is a threshold claim too. A panel that turns red at a value nobody would act on teaches operators to ignore red, which is the most expensive lesson a dashboard can teach. Reserve strong colour for actionable states.
Annotations carry the other half of diagnosis: deploy markers and change events, drawn vertically across every panel at the moment they happened. “Did something change?” is answered by alignment, and alignment only works when every panel shares the time range and the annotations come from the deployment system automatically rather than from someone remembering to add them. Wire the annotation source to your deploy pipeline once and every dashboard inherits the benefit.
Variables that narrow scope instead of multiplying dashboards
Template variables exist so one dashboard serves every instance of a pattern: one service dashboard parameterised by service, environment, and region. The failure mode is the fleet of near-identical per-service dashboards, each drifting as someone edits one and forgets the others, until the dashboard for the service you are debugging is the stale one.
Build the service dashboard as a single templated artefact, provisioned from code, with the service variable driving every query. Then per-service differences become data, labels on the metrics, rather than copies of the dashboard. Two cautions keep variables honest. A variable with hundreds of values needs a search and a sensible default, or the operator spends the incident scrolling a dropdown. And a variable must never silently filter a panel to nothing: an empty panel caused by a variable mismatch looks identical to an empty panel caused by an outage, so label panels with the variable values they are scoped to.
Provisioning dashboards from code, whether as JSON in a repository or through Grafana’s provisioning and API mechanisms, is what makes all of the above sustainable. A dashboard that exists only as clicks in a UI cannot be reviewed, cannot be kept consistent across services, and cannot be restored with confidence. Treat dashboard changes like code changes: proposed, reviewed against the question list, and deployed.
Prune on a schedule, because dashboards accrete
Every panel on every dashboard was added during some incident or review when it seemed useful. Almost none are ever removed, because removal feels riskier than clutter. Invert that: review the service dashboard on a regular cadence, walk the question list, and delete any panel that no longer answers a listed question or that nobody can explain. Panels with no viewers and panels duplicated by a better panel nearby are the first to go. A shorter dashboard that loads fast and reads in one screenful during triage beats a comprehensive one that answers everything eventually, because during an incident, eventually is a cost measured in user impact.
Verdict
A dashboard is a set of claims about what matters, arranged for a reader under pressure. Build it from the questions: symptoms first with RED panels showing proportions and percentiles rather than counts and averages, resources second with USE panels that include saturation, thresholds drawn where the alerts actually are, deploy annotations on a single shared time axis, and one templated dashboard per pattern instead of a copy per service. Then prune it like you mean it. The result answers the operator’s questions in the order they ask them, which is the entire difference between a dashboard that displays data and one that helps end an incident.