DevOps & observability / Tutorial
Prometheus Metrics That Don't Explode: Cardinality, Naming, and the Queries You'll Actually Run
Design Prometheus metrics that stay queryable under load: naming, label discipline, histograms, and the PromQL for errors, latency, and saturation.
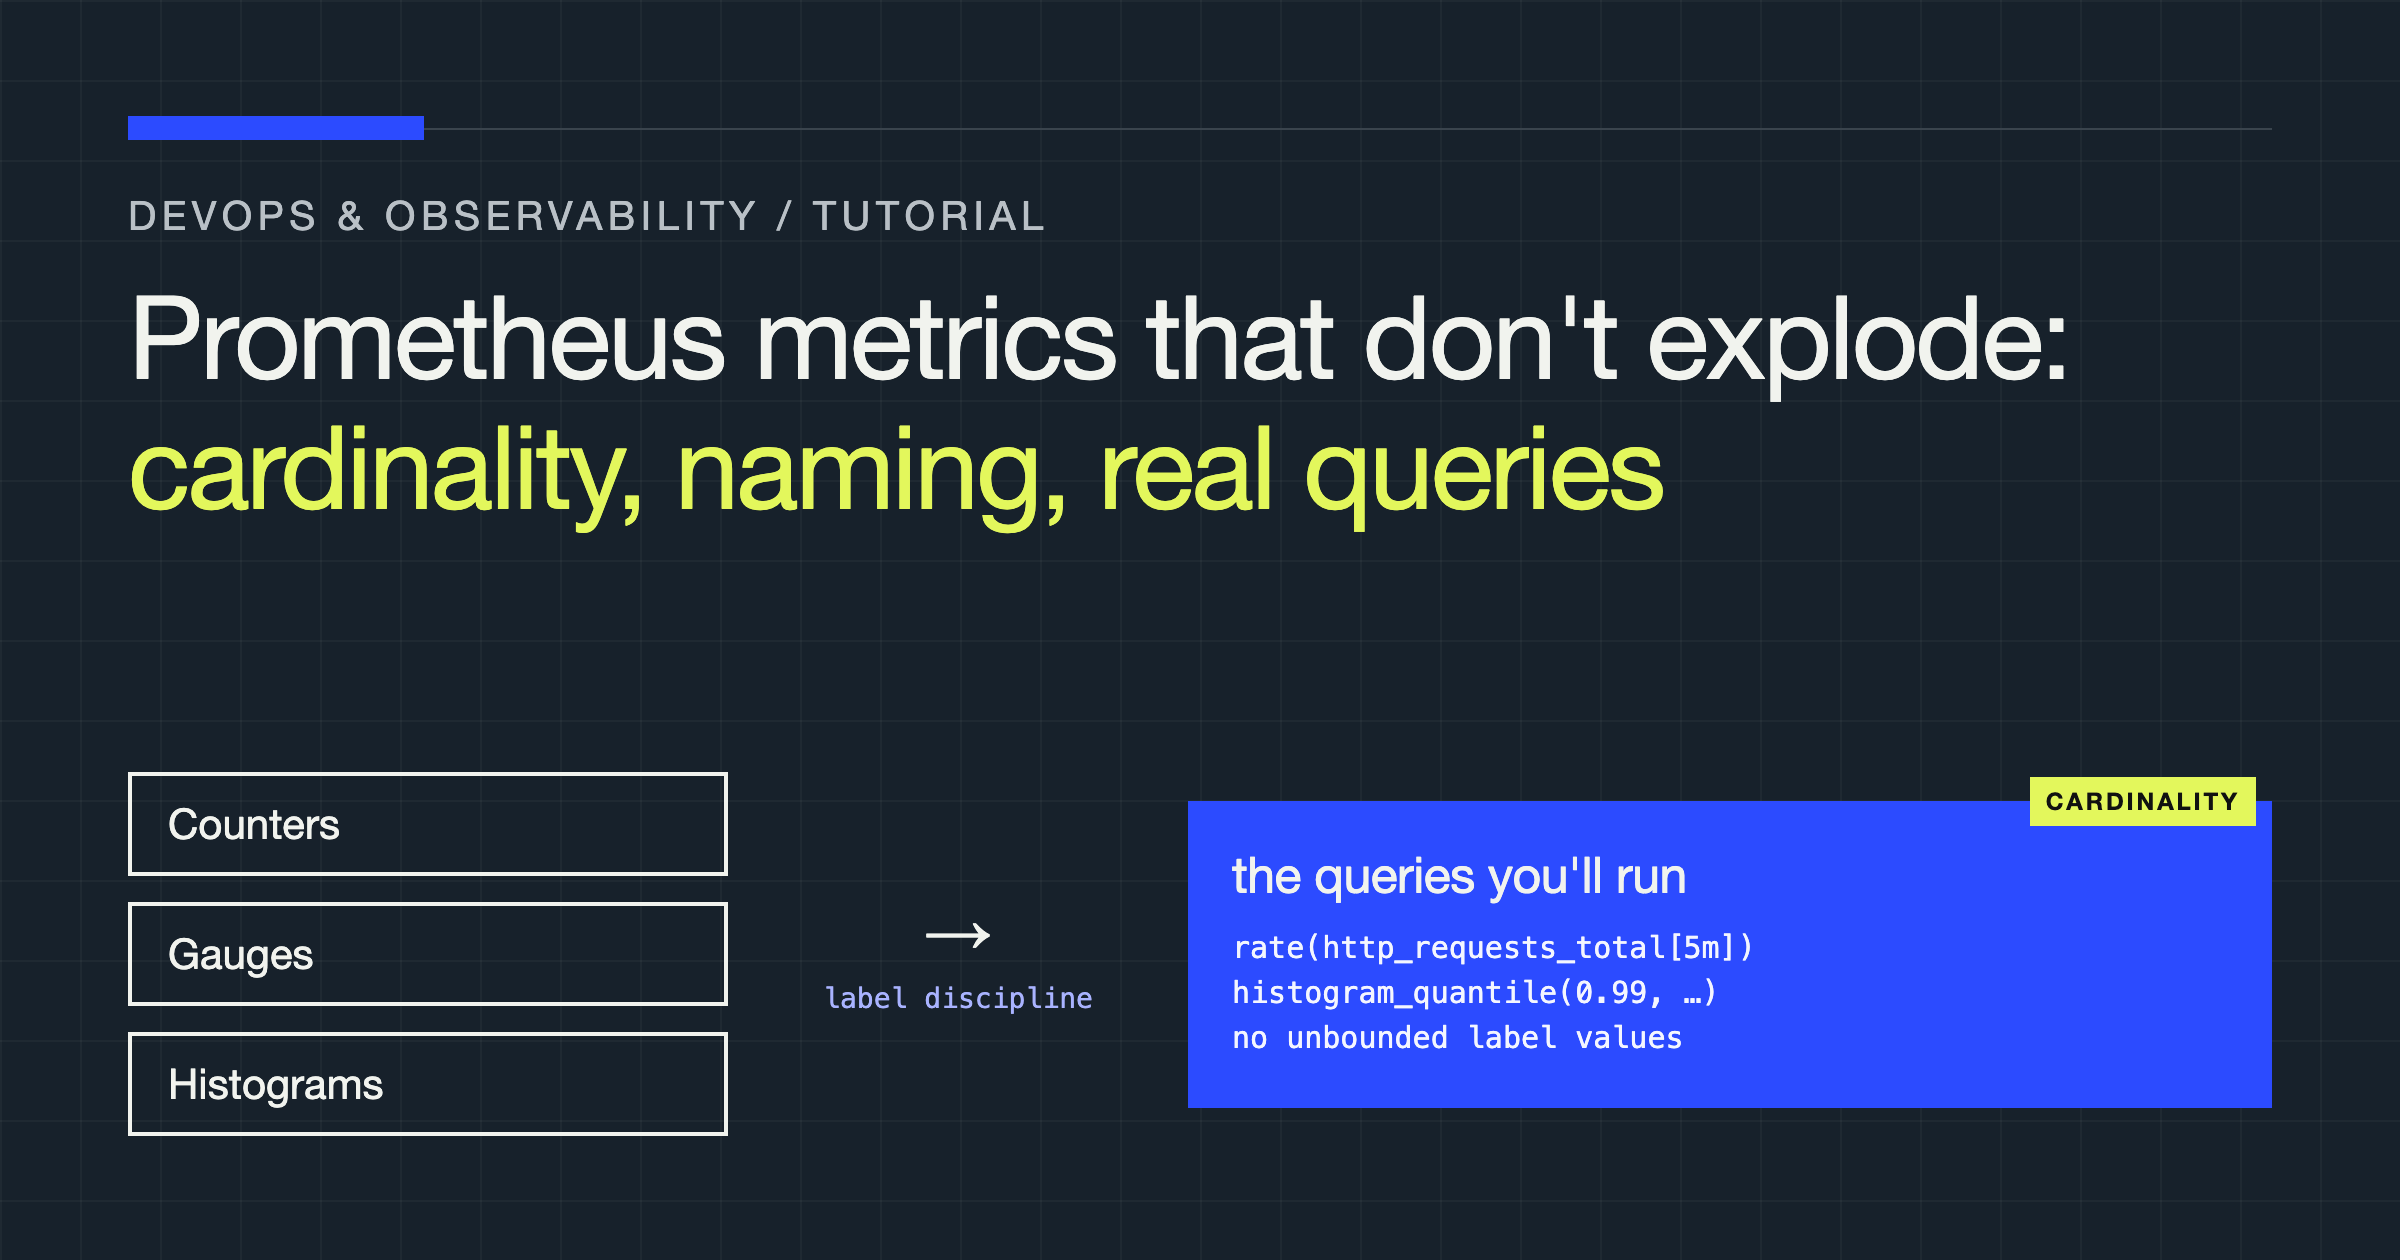
You will design a metric set you can alert on, dashboard, and debug later without rewriting instrumentation or bankrupting your Prometheus server. By the end, you will know which of the four metric types to pick, how to name a metric so its unit and meaning are obvious from the name alone, how to keep label cardinality bounded, when a histogram beats a summary, and how to write the four queries you will run in almost every incident: request rate, error ratio, latency quantiles, and saturation.
Most metric problems are not query problems. They are design problems baked in at instrumentation time, and no clever PromQL can undo a high-cardinality label or recover buckets you never recorded.
The four metric types, and when each one lies to you
Prometheus gives you counters, gauges, histograms, and summaries. They are not interchangeable containers for numbers. Each makes a different promise, and each misleads you in a specific way when used for the wrong job.
A counter only goes up, except when the process restarts and it resets to zero. Use it for things that accumulate: requests served, errors, bytes sent, tasks completed. The lie is the raw value: it tells you almost nothing without knowing the period or restart history. Counters are only useful through rate() or increase(), which handle resets correctly. Graph a raw counter and you are graphing restart history, not work.
A gauge goes up and down. Use it for a current state you can measure at scrape time: in-flight requests, queue depth, memory in use, connection pool size. The lie is sampling: a spike that starts and ends between scrapes never existed in your data. Do not turn a gauge into an event log by incrementing and decrementing it for things you cannot recount; miss a decrement on an error path and the gauge drifts forever. For event counts, use a counter. For a value you can recompute at any moment, use a gauge.
A histogram counts observations into configured buckets and also tracks their sum and total count. Use it for request durations and response sizes — anything where the distribution matters, not just the average. The lie is bucket resolution. Prometheus does not store raw observations, only how many fell into each bucket, so a quantile can never be more precise than the bucket boundaries allow, and anything above your highest finite bucket lands in +Inf, where you know only that it was large. Choose buckets around thresholds you care about, especially your service-level objectives.
A summary calculates quantiles on the client, over a sliding window, and exposes them directly. The lie is aggregation. Because the quantile was precomputed per instance, you cannot merge summaries from multiple instances into a correct fleet-wide quantile — averaging quantiles is mathematically meaningless. That is why histograms are the default in multi-instance services, even though summaries look more convenient.
Naming: the name is the documentation
A good metric name answers three questions without a lookup: what is measured, in what unit, and — for counters — that it is cumulative. Follow the conventions the ecosystem and its linters expect, because other teams’ queries will assume them.
Use a single-word application prefix, then the thing, then the base unit in plural form: http_requests_total, http_request_duration_seconds, process_resident_memory_bytes, queue_messages. The rules that do the real work:
- Counters end in
_total. Client libraries andpromtoolexpect it, and the suffix warns the reader not to graph the raw value. - Use base units. Seconds, not milliseconds. Bytes, not megabytes. Ratios as a fraction between 0 and 1, not percentages. A name that says
_secondswhile the code records milliseconds is worse than no unit, because every query against it will be silently wrong. - Do not encode the type in the name. You do not need
_counteror_gauge. - Do not put labels in the name.
http_requests_get_totalandhttp_requests_post_totalshould be one metric,http_requests_total, withmethodandcodelabels. Separate names fragment queries; labels keep them composable. - One name, one meaning, everywhere. If two services export
job_duration_secondsbut one measures queue wait and the other execution, you cannot aggregate them safely. Names are a fleet-wide contract.
# HELP http_requests_total Total HTTP requests processed, by method, route, and status code.
# TYPE http_requests_total counter
http_requests_total{method="GET", route="/v1/orders", code="200"} 1842
http_requests_total{method="GET", route="/v1/orders", code="500"} 17

# HELP http_request_duration_seconds HTTP request duration in seconds.
# TYPE http_request_duration_seconds histogram
http_request_duration_seconds_bucket{method="GET", route="/v1/orders", le="0.1"} 1520
http_request_duration_seconds_bucket{method="GET", route="/v1/orders", le="0.5"} 1811
http_request_duration_seconds_bucket{method="GET", route="/v1/orders", le="+Inf"} 1859
http_request_duration_seconds_sum{method="GET", route="/v1/orders"} 96.4
http_request_duration_seconds_count{method="GET", route="/v1/orders"} 1859
Note that histogram buckets are cumulative: each le series counts every observation less than or equal to that bound. That makes histogram_quantile() possible — and it is why many buckets multiplied by many label combinations is expensive. You pay for every bucket as a separate time series.
Label discipline and the cardinality explosion
Cardinality is the number of unique time series a metric produces: for one metric, the product of the distinct values of every label on it. Add a label with ten values to a metric that already has a hundred series, and you do not get ten more series. You get ten times as many.
Every unique combination is a separate series stored in memory and on disk, indexed, and scanned by queries. Bounded labels are fine and necessary: HTTP method, status code, route template, instance, result. Unbounded labels are how a server falls over after a deploy that looked harmless in review.
Dangerous values grow with your users, traffic, or data instead of with your code. User IDs, request IDs, session IDs, email addresses, full URLs with IDs in the path, error message strings, and timestamps belong in logs and traces, not metric labels. Logs are built for high-cardinality, per-event detail; metrics are built for aggregation over a deliberately small set of dimensions. Put the identifier in the trace, link it to the metric with an exemplar, and keep the metric coarse.
Defensively: audit label values, not just label names, in instrumentation reviews, and require any new label to have a finite value set you can list in the pull request. Prefer enumerated outcomes — result="success|timeout|client_error|server_error" — over raw exception text.
Exemplars are the bridge to detail. A histogram or counter series can carry one example observation annotated with a trace ID, so in a supporting UI you can jump from a latency spike to a real trace that contributed to it. Exemplars do not change cardinality and do not replace tracing; they store very few samples, best-effort. Treat them as a convenience link, not data you query.
Histograms versus summaries
This is the decision people get wrong most often, usually by choosing summaries because the quantile appears without query work.
| Property | Histogram | Summary |
|---|---|---|
| Where quantiles are computed | At query time, with histogram_quantile() | On the client, before scraping |
| Aggregates across instances | Yes — buckets from many instances combine correctly | No — per-instance quantiles cannot be merged |
| Cost driver | Number of buckets multiplied by label combinations | Number of configured quantiles multiplied by label combinations |
| Bucket or quantile flexibility | Change the query quantile any time; bucket bounds are fixed at instrumentation | Quantiles are fixed at instrumentation |
| Accuracy | Approximate, bounded by bucket width near the quantile | More precise for the configured quantiles on that one instance |
| Typical use | Service latency across a fleet, SLO reporting | A single-process client library measuring its own internal operation |
Reach for a histogram by default. It is the only one that survives the normal shape of production: many instances behind a load balancer, instances that come and go, and an SLO defined over the whole service. Use a summary only for a genuinely single instance, or when you only care about each instance in isolation.
Bucket selection deserves care. Too few buckets and your quantile is a coarse guess; too many and you multiply the cost of every label combination. Pick boundaries that bracket your SLO threshold closely — a boundary exactly at that threshold gives the estimator the most information where it matters — and span from well below typical latency to well above the worst you care about distinguishing. With native histograms, where your client library and server support them, bucket resolution improves and series cost drops; the principles about labels and aggregation stay the same.
Relabeling: fix labels at the edge, carefully
Relabeling rewrites labels during scraping (relabel_configs) or after it (metric_relabel_configs). It is the right tool for normalising other people’s exporters: dropping a useless label, renaming an inconsistent one, or dropping series you never query before they cost storage.
scrape_configs:
  - job_name: "app"
    static_configs:
      - targets: ["localhost:8080"]
    metric_relabel_configs:
      # Drop per-scrape bookkeeping series you never query.
      - source_labels: [__name__]
        regex: "go_gc_duration_seconds|process_open_fds"
        action: drop
      # Normalise an inconsistent status label from a third-party exporter.
      - source_labels: [status]
        target_label: code
        replacement: "$1"
      - regex: "status"
        action: labeldrop
Use it with restraint. Relabeling can drop or rename, but it cannot recover information never exported. Dropping high-cardinality series at ingestion protects the server, but it is a bandage: the exporter still generates the load, and the next person will not understand why data disappears. Fix cardinality in instrumentation when you own the code; reserve relabeling for third-party exporters and known dead weight. Be careful with labeldrop and labelmap too: a broad regex that matches a label you later need removes it silently, with no scrape error.
The queries you will actually run
Four patterns cover most dashboards and alerts. Promote them to recording rules once you use them repeatedly, so every dashboard and alert reads the same precomputed series instead of re-scanning raw data and possibly disagreeing.
Request rate, split by route:
sum by (route) (
  rate(http_requests_total[5m])
)
Error ratio — the query behind most availability alerts. It divides two rates over the same window; guard against a zero denominator during quiet periods:
sum by (route) (
  rate(http_requests_total{code=~"5.."}[5m])
)
/
sum by (route) (
  rate(http_requests_total[5m])
)
Latency quantile from a histogram. histogram_quantile() needs the bucket metric and the le label intact, so do not strip labels before you call it:
histogram_quantile(
  0.95,
  sum by (le, route) (
    rate(http_request_duration_seconds_bucket[5m])
  )
)
Saturation — how full a finite resource is. For a pool, queue, or limit, this is a gauge ratio, and it is more actionable than utilisation alone because it shows how close you are to refusing work:
queue_depth / queue_capacity

db_connection_pool_in_use / db_connection_pool_max
And the instrumentation that produces the first three, using the Python client library’s standard conventions:
from prometheus_client import Counter, Histogram

REQUESTS = Counter(
    "http_requests_total",
    "Total HTTP requests processed.",
    labelnames=("method", "route", "code"),
)

DURATION = Histogram(
    "http_request_duration_seconds",
    "HTTP request duration in seconds.",
    labelnames=("method", "route"),
    buckets=(0.005, 0.01, 0.025, 0.05, 0.1, 0.25, 0.5, 1.0, 2.5, 5.0),
)

def handle(request):
    with DURATION.labels(method=request.method, route=request.route_template).time():
        response = dispatch(request)
    REQUESTS.labels(
        method=request.method,
        route=request.route_template,
        code=str(response.status_code),
    ).inc()
    return response
Two pitfalls to build into your habits. First, rate() needs a range containing several scrapes; a shorter window is extrapolation over almost nothing, and a counter younger than the window will be extrapolated as if it were not. Use windows of at least a few minutes for alerting. Second, a ratio from low traffic is noisy in a way that looks exactly like an incident. Pair ratio alerts with a minimum request-rate condition, so a quiet service with a handful of requests does not page you.
Anti-patterns at a glance
| Anti-pattern | Why it hurts | Do this instead |
|---|---|---|
| Label with user ID, request ID, or full URL | Unbounded series growth, memory pressure, slow queries | Put identifiers in logs and traces; link with exemplars |
| Request duration as a gauge or average-only counter | Loses the distribution, hides tail latency | Histogram with buckets bracketing your SLO |
| Summary on a multi-instance service | Per-instance quantiles cannot be aggregated | Histogram, quantified at query time |
| Milliseconds or percent in the value | Every query must guess the unit, dashboards disagree | Base units: seconds, bytes, ratios from 0 to 1 |
| Metric name per status or per method | Fragmented queries, duplicated instrumentation | One metric, low-cardinality labels |
| Raw exception text as a label value | Unbounded and constantly changing | A small enumerated result or error_type label |
| Dropping cardinality only with relabeling | Hides the design flaw, data vanishes silently | Fix instrumentation; use relabeling for third-party exporters |
Verdict
Design metrics backwards from the questions you will ask in an incident. Start every service with counters for requests and errors labelled by route, method, and status code; a histogram for duration with buckets around your SLO; and gauges for finite resources that can saturate. Keep every label’s value set finite, listable, and derived from your code rather than your traffic. Use base units, _total on counters, and one meaning per name. Default to histograms over summaries unless you can prove aggregation across instances will never matter.
If you inherit a set that already explodes, do not start by tuning Prometheus. Find the label whose values grow with traffic, remove it, move that detail into logs and traces, and keep an exemplar so you can still jump from graph to real request. That one change fixes more production metric systems than any query optimisation.